About Pairoscope


Pairoscope (formerly Yenta) was developed as a quick and simple way to generate diagrams indicating the relationship of paired end sequencing reads. It functions by displaying multiple genomic regions, their read depth at each base in the region and arcs within or between regions to indicate pairing information. Currently, Pairoscope supports the graphing of multiple regions, but they must be at different locations: the behavior of Pairoscope is undefined if attempting to graph the same region twice. It uses a bam file as input, and color codes the read pair graph to reflect different types of abnormally oriented reads. Individual reads are represented as vertical lines drawn at the genomic location where the read mapped. When both reads of a pair are present in the displayed region, the reads are linked by an arc. Reads lying at the same position are drawn on top of each other. In addition to displaying read pair information, Pairoscope also displays the read depth over the region as a separate graph. At the moment, Pairoscope only provides display of reads with abnormal orientations with respect to the reference; deletion and insertion events are not yet supported. In addition, it assumes orientations and colors reflecting the expected orientations for a standard Illumina Paired-End library. It is in beta right now and stability may be an issue.
Example


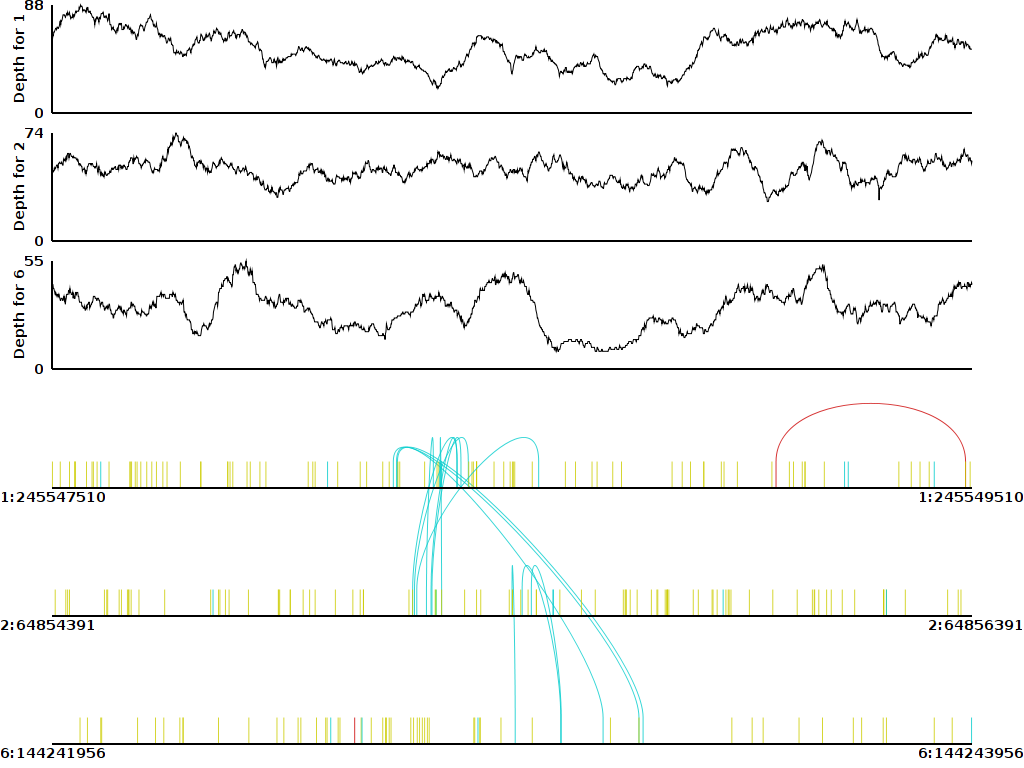
Pairoscope is most useful for visualizing translocations. Below is an example from our recent seqeuncing of a breast cancer quartet.

Example Translocation Image

Each track is a different chromosome. The blue arcs between them illustrate paired reads that span the chromosomes and support a translocation.

Installation


32-bit Linux binaries are available for download. Compiling Pairoscope yourself requires the Samtools C library, cmake and Cairo.

Once these packages are installed, compiling Pairoscope should be relatively simple.

  1. Within the main directory type: ccmake .
  2. You will see the graphical interface to the cmake build system. Hit [c] to start compilation.
  3. You will most likely get an error message regarding the location of the samtools include directory and library directory. Follow the onscreen directions to set the include directory to the location of the samtools sourcecode. If you have not moved the samtools libbam.a library to outside its default location within this same directory, merely hit [c] again. Otherwise, set full path of Samtool_LIBRARY to the location of the library eg /usr/lib/libbam.a .
  4. At this point you should have no errors. Hit [g] to generate makefiles. The cmake utility should exit.
  5. Type make.

Compilation and installation has been tested on the Genome Center's Ubuntu Linux systems using gcc 4.2.4, Cairo 1.6.0, samtools 1.7 and cmake version 2.4-patch7. I have done limited testing on Mac OS X 10.5.8.. Please post issues to the help forum.

Manual


Pairoscope requires at least one bam file to run. Your bam file should be sorted and indexed. The help output for pairoscope is below.

Usage:   pairoscope [options] <align.bam> <chr> <start> <end> 
         <align2.bam> <chr2> <start2> <end2> 

Options: -q INT    minimum mapping quality [0]
         -p FLAG   output in pdf instead of png
         -b INT    size of buffer around region to include [100]
         -n FLAG   print the normal pairs too
         -o STRING filename of the output png
         -W INT    Width of the document [1024]
         -H INT    Height of the document [768]
         -g STRING bam file of exons for gene models
         -f STRING list of types of maq flags for display

Colors

Mapping status Color
Forward-Reverse gray
Forward-Forward red
Reverse-Reverse blue
Reverse-Forward green
One read unmapped yellow
One read mapped to a different chromosome cyan

Notes

  • The minimum mapping quality parameter filters each read individually. For reads that are abnormally mapped, the mapping quality may differ between reads in a pair and thus, you may observe a single read being filtered out and not its mate for these pairs.
  • The filename does not automatically append a .png suffix to the passed string .
  • Image dimensions are in pixels. Images are scaled to fit the image size so it may be helpful on large regions to specify a larger document size. Currently the font is rendered with a size of 14 pixels, so large images will have illegible axis labels and small images will have abnormally large fonts. The defaults are best in most cases.
  • Drawing normal reads along with quality filtering may help to determine if a variant is homozygous or heterozygous, but only on small regions with good coverage.
  • You can tweak Pairoscope graphs by choosing to output in pdf and editing with a compatible vector graphics editor like Adobe Illustrator. Unfortunately, the fonts do not seem to embed properly at this time.
  • A bam file containing special tags and entries indicating the location of exons can be used to display gene models. This feature is currently poorly supported and undocumented.